


下载
1
ATT (dB)
f
S
/2
f
S
– f
A2
f
S
– f
A1
f
S
P
2
F
0
–20
–40
–60
–80
–100
P
1
Signal Frequency Sampling Spectrum
f
A
f
S
+ f
A
f
S
– f
A
f
S
f
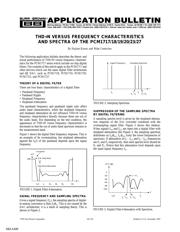
SIGNAL FREQUENCY AND SAMPLING SPECTRA
Given a signal frequency (f
A
), the sampling spectra of digital-
to-analog conversion is then f
S
±f
A
. This is not caused by the
DAC architecture, it is a result of sampling theory. This is
shown in Figure 2.
1
®
THD+N VERSUS FREQUENCY CHARACTERISTICS
AND SPECTRA OF THE PCM1717/18/19/20/23/27
By Hajime Kawai and Mike Centorino
©
1997 Burr-Brown Corporation AB-124 Printed in U.S.A. November, 1997
The following application bulletin describes the theory and
actual performance of THD+N versus frequency character-
istics for the PCM1717 series which include on-chip digital
filters. The contents of this article apply to the PCM1717 and
other devices which use the same digital filter architecture
and ∆Σ DAC, such as PCM1718, PCM1719, PCM1720,
PCM1723, and PCM1727.
THEORY OF A DIGITAL FILTER
There are four basic characteristics of a digital filter:
• Passband Frequency
• Passband Ripple
• Stopband Frequency
• Stopband Attenuation
The passband frequency and passband ripple only affect
audio band characteristics, while the stopband frequency
and stopband attenuation do not influence THD+N versus
frequency characteristics directly because these are out of
the audio band. But depending on the test condition, the
appearance of THD+N versus frequency characteristics is
decreased so that the out of audio band spectrum remains in
the measurement band.
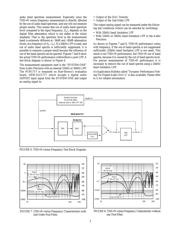
Figure 1 shows the digital filter frequency response. This is
an example of 8x oversampling, but stopband attenuation
against the f
S
/2 of the passband depends upon the signal
frequency.
FIGURE 2. Sampling Spectrum.
FIGURE 1. Digital Filter Attenuation.
ATT
f
S
/2 f
S
2f
S
4f
S
6f
S
8f
S
f
0dB
Stop Band
Passband
Stop Band Attenuation
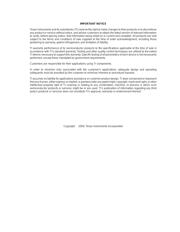
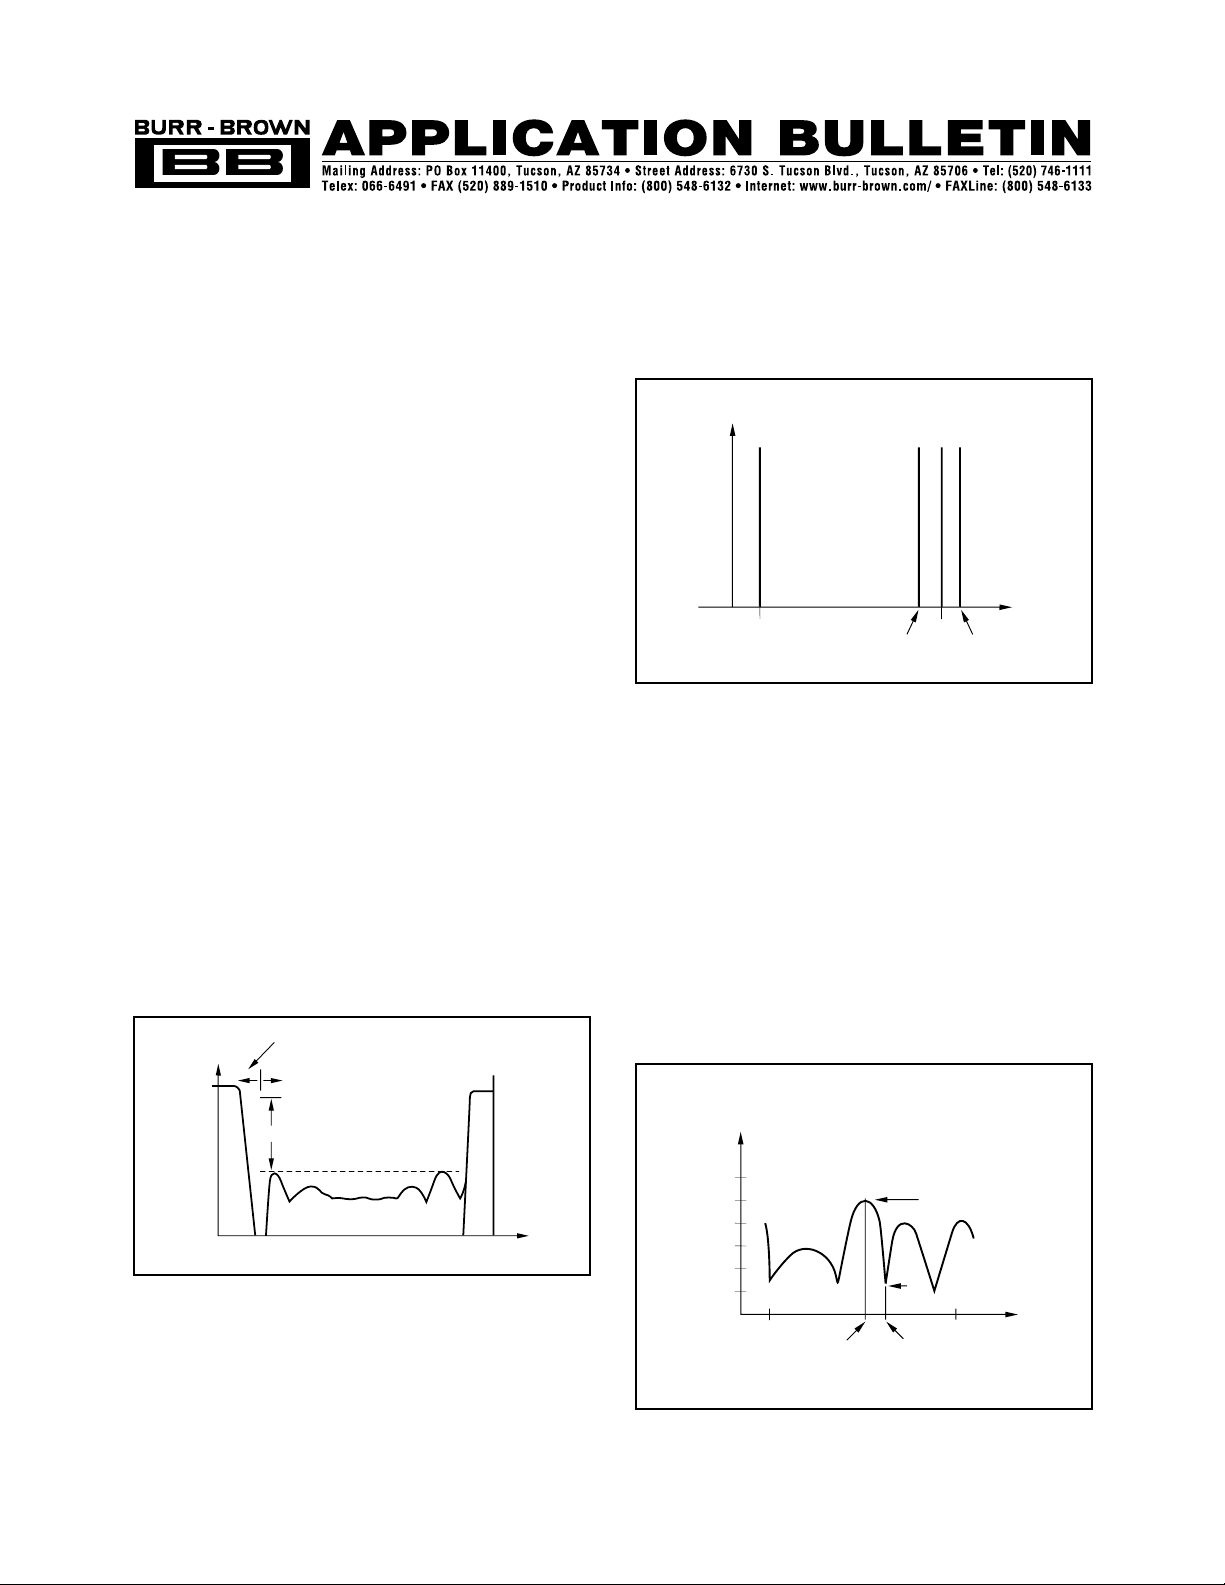
SUPPRESSION OF THE SAMPLING SPECTRA
BY DIGITAL FILTERING
A sampling spectra level is given by the stopband attenua-
tion response of the D/A converter combined with the
oversampling signal filter. Figure 3 shows this relation.
When signals f
A1
and f
A2
are input into a digital filter with
stopband attenuation like Figure 3, the sampling spectrum
distributes on f
S
±f
A1
, f
S
±f
A2
(only the lower frequencies of
spectrum). If attenuation at f
S
– f
A1
and f
S
– f
A2
frequencies
are P
1
and P
2
respectively, then each spectra level should be
P
1
and P
2
. Notice that this attenuation level depends upon
the input signal frequency f
A
.
FIGURE 3. Digital Filter Attenuation with Spectrum.
SBAA020